
What is a Confusion Matrix in GIS?
A confusion matrix, also known as an error matrix, is a powerful tool in GIS and remote sensing that helps you evaluate the accuracy of your classification results. It provides a detailed breakdown of how well your classification model performed by comparing predicted classes against actual ground truth data.
Real-World Application
Consider a scenario where you're classifying land cover types in a satellite image:
- You need to identify different land cover types (forest, water, urban areas)
- You want to know how accurate your classification is
- You need to understand where and why errors occur
- You want to improve your classification process
A confusion matrix provides the quantitative foundation for all these needs, making it an essential tool in GIS analysis and remote sensing applications.
Understanding Confusion Matrices Through Examples
Binary Classification Example
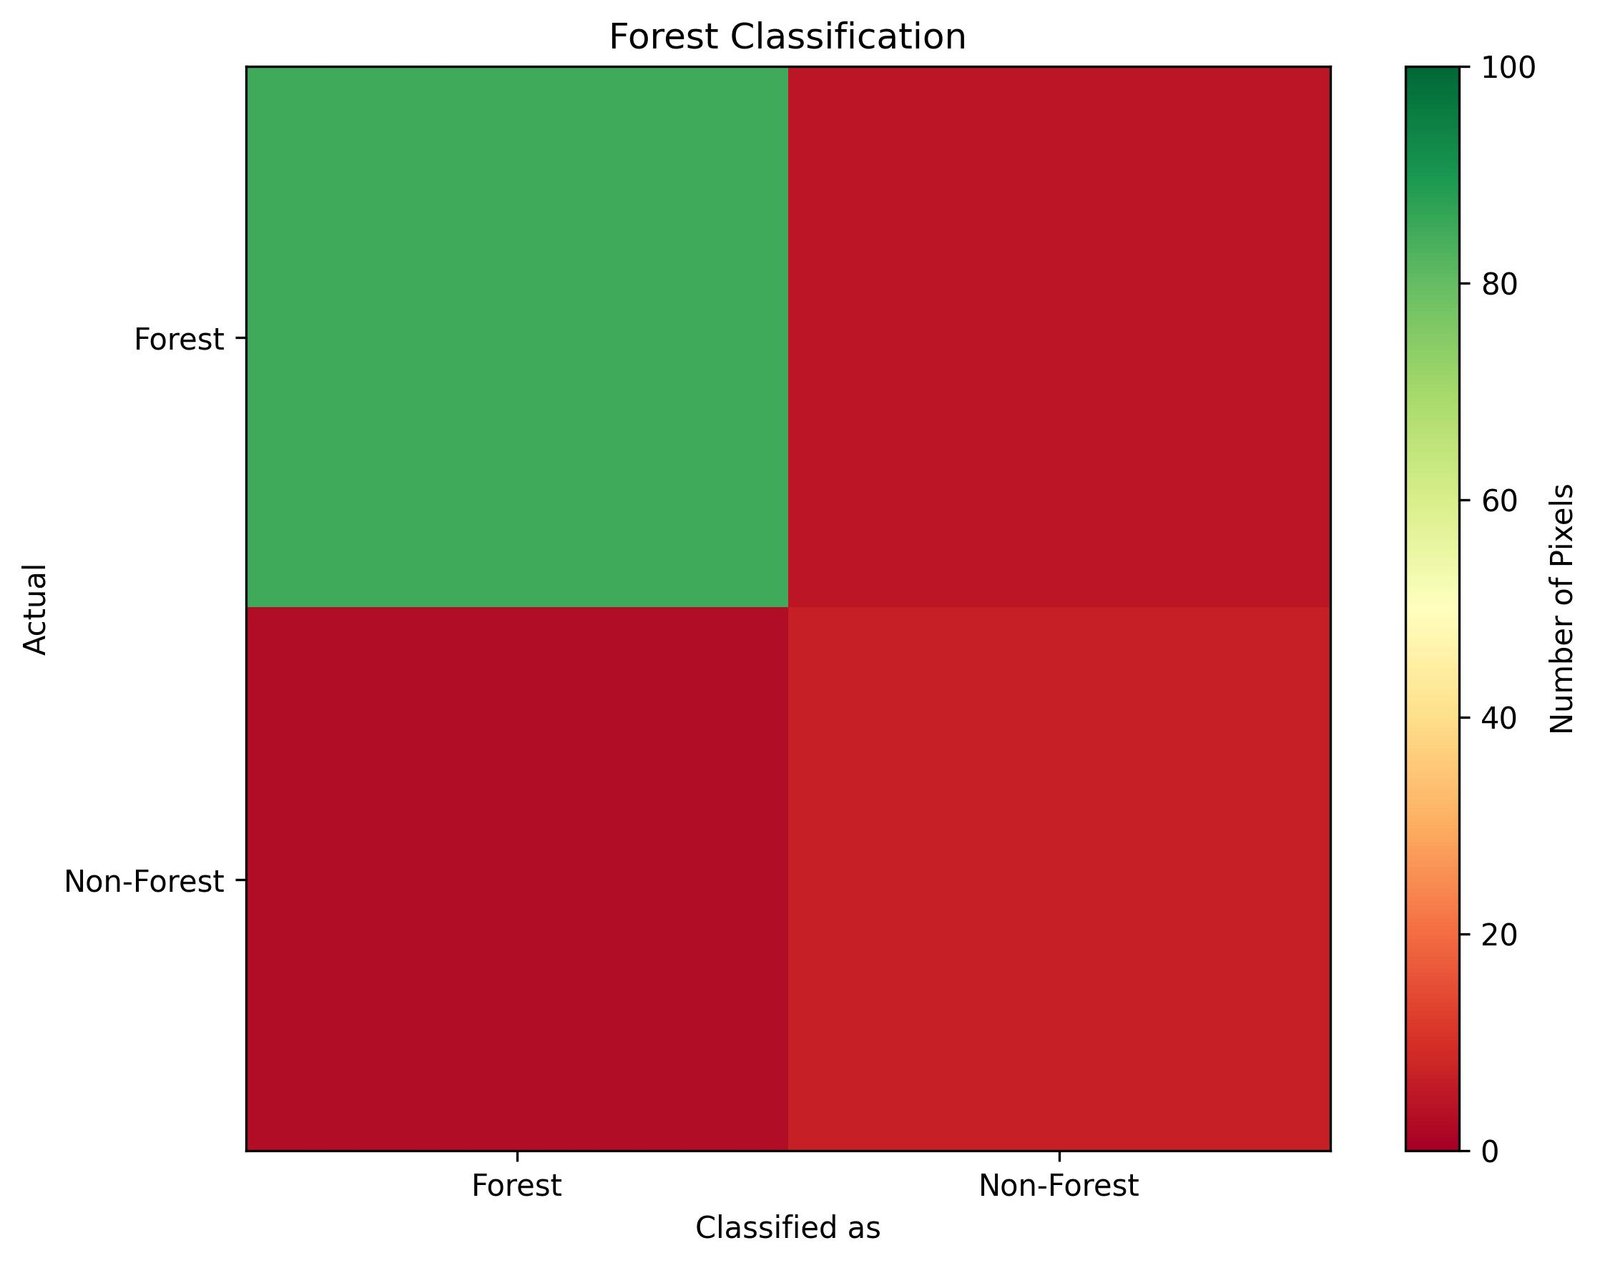
Forest vs. Non-Forest Classification Results
Multi-Class Classification Example
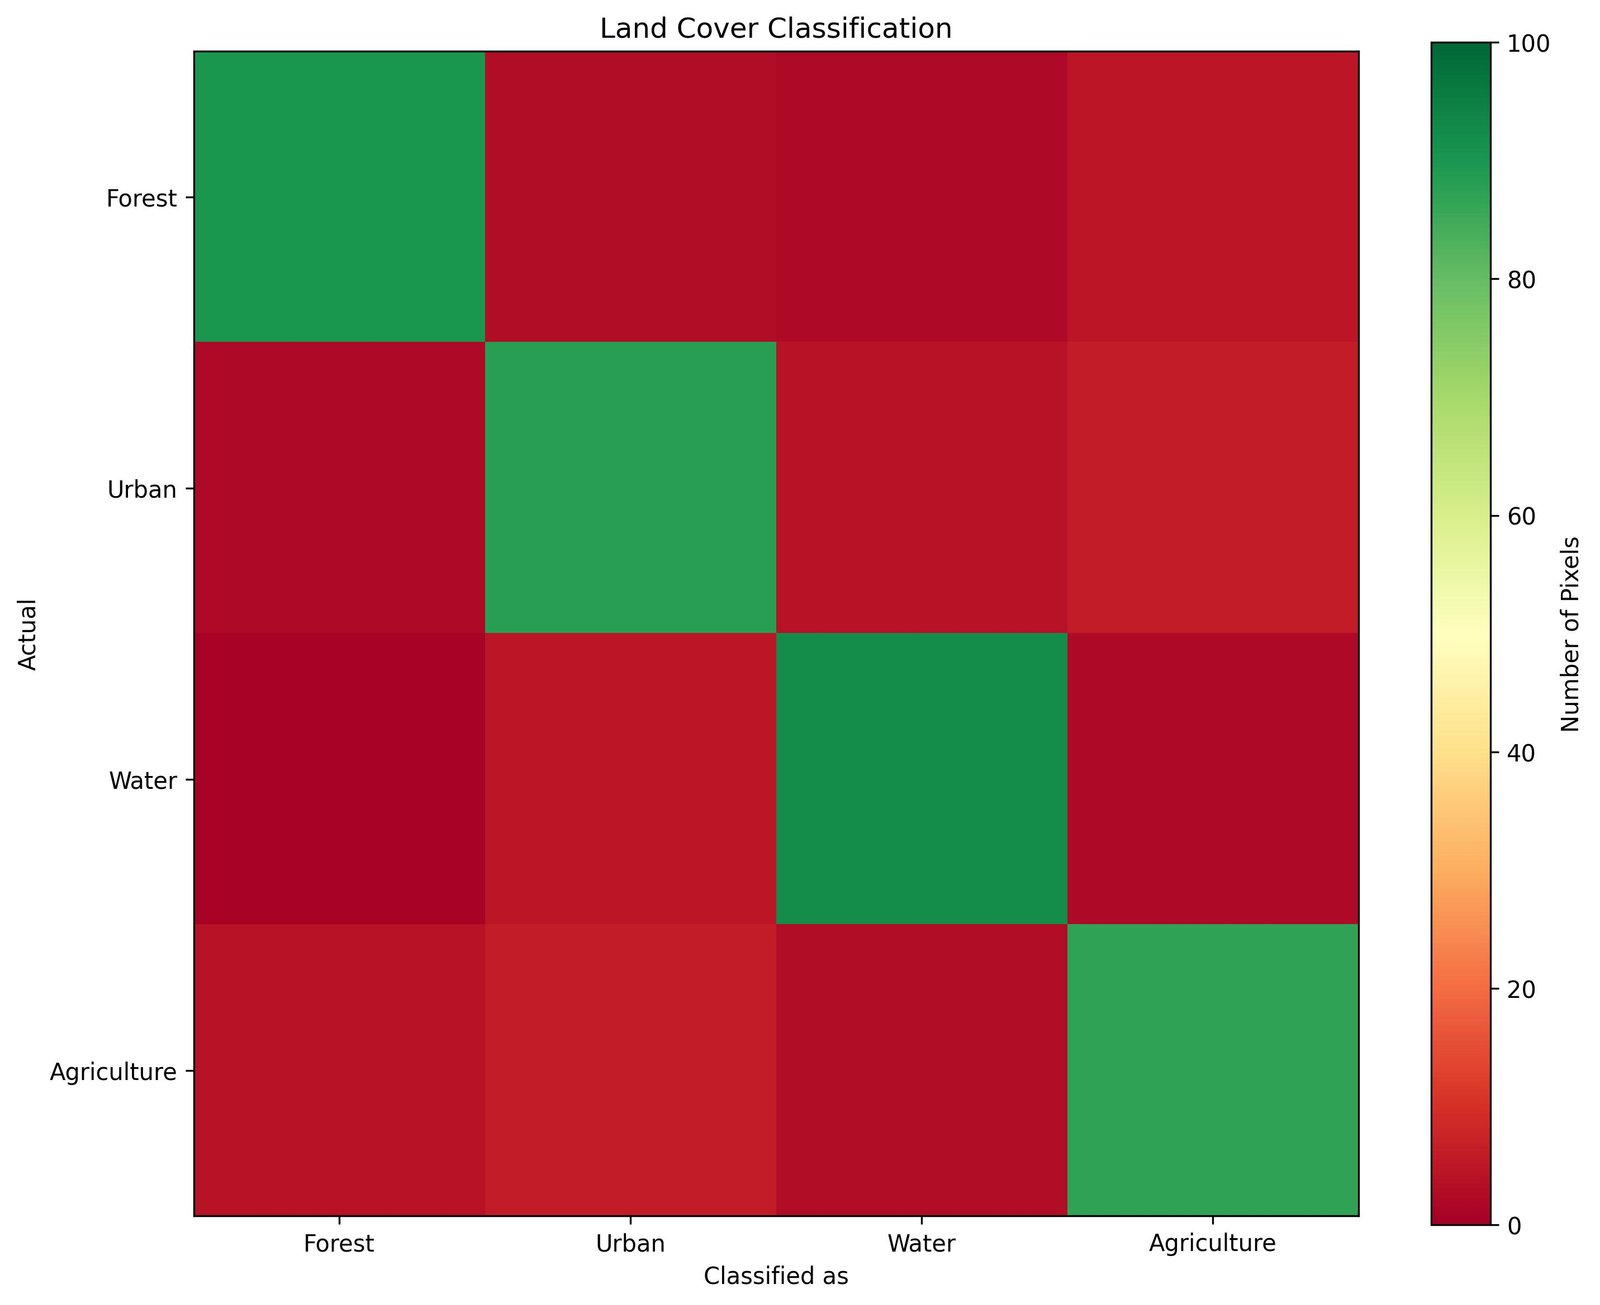
Land Cover Classification Results
| Classified as | ||
|---|---|---|
| Actual | Forest | Non-Forest |
| Forest | 85 | 5 |
| Non-Forest | 3 | 7 |
Key Takeaways
- Green cells indicate correct classifications
- Red cells show classification errors
- Rows represent actual ground truth data
- Columns show your classification results
Key Components of a Confusion Matrix
Understanding Classification Outcomes
In GIS classification, there are four possible outcomes for each pixel or area:
- True Positive (TP): Correctly identified as the target class
- False Positive (FP): Incorrectly classified as the target class
- False Negative (FN): Missed identification of the target class
- True Negative (TN): Correctly identified as not the target class
| Component | Definition | GIS Example |
|---|---|---|
| True Positive (TP) | Correct classification of the target class | Correctly identifying a forest area as forest |
| False Positive (FP) | Incorrect classification as the target class | Mistaking a water body for forest |
| False Negative (FN) | Missing the target class in classification | Failing to identify a forest area |
| True Negative (TN) | Correct identification of non-target class | Correctly identifying a non-forest area |
Calculating Classification Accuracy
Accuracy Metrics in GIS
Several key metrics help evaluate the performance of your classification:
- Overall Accuracy: Total correct classifications divided by total samples
- Producer's Accuracy: Measures how well reference data is classified
- User's Accuracy: Measures reliability of the classification map
- Kappa Coefficient: Measures agreement between classification and reference data
Overall Accuracy Calculation
The simplest and most commonly used accuracy metric:
Overall Accuracy = (TP + TN) / Total Samples
= (85 + 7) / 100
= 92 / 100
= 92%
This indicates that 92% of all classifications were correct.
Class-Specific Accuracy
Measures accuracy for individual classes:
Producer's Accuracy (Forest) = TP / (TP + FN)
= 85 / (85 + 5)
= 85 / 90
= 94.4%

User's Accuracy (Forest) = TP / (TP + FP)
= 85 / (85 + 3)
= 85 / 88
= 96.6%
High producer's and user's accuracy indicate reliable classification.
Best Practices for Using Confusion Matrices
Data Collection
- Use representative sample sizes
- Ensure balanced class distribution
- Collect ground truth data systematically
- Document sampling methodology
Analysis and Interpretation
- Calculate multiple accuracy metrics
- Consider class-specific accuracies
- Identify patterns in misclassification
- Document limitations and assumptions
Conclusion
Confusion matrices are essential tools in GIS and remote sensing for evaluating classification accuracy. By understanding and properly implementing confusion matrices, you can:
- Quantify the accuracy of your classification results
- Identify specific areas of misclassification
- Improve your classification methodology
- Communicate results effectively to stakeholders
Next Steps
To further enhance your understanding of confusion matrices in GIS:
- Practice creating confusion matrices with your own data
- Explore advanced accuracy assessment techniques
- Learn about statistical significance testing
- Consider implementing automated accuracy assessment tools